Early ‘pre-azotaemic’ diagnosis of CKD
Hattie Syme 2026
Key points
Why it matters: Nephron loss is permanent, and treatment slows progression rather than restoring GFR. Detecting CKD earlier lets intervention start while more nephrons remain.
Why filtration biomarkers miss early disease:
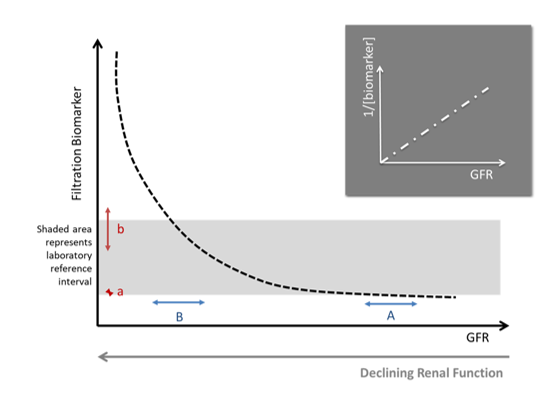
Their relationship with GFR is hyperbolic, so large GFR losses cause little change at first.
Remnant nephrons hyperfilter and hypertrophy, masking nephron loss.
Baseline GFR varies widely between individuals and breeds, giving wide reference intervals.
Biomarker limits: Creatinine, SDMA and the others share these limits. Lowering cut-offs improves sensitivity but costs specificity, and results are often discordant, so clinical judgement is needed.
Longitudinal monitoring: A baseline from a healthy young animal makes biomarkers more sensitive. Rises beyond the critical difference suggest reduced GFR, once pre-renal, post-renal and acute causes are excluded.
GFR-independent indicators: Sustained renal proteinuria and breed-specific genetic tests can diagnose CKD without azotaemia.
Imaging: Can support diagnosis and helps separate acute from chronic disease, but findings are often non-specific.
Overall: Early CKD is diagnosed by combining several lines of evidence rather than a single test, and for some animals, the long-term clinical significance could be unclear
-
Filtration biomarkers are insensitive markers of nephron loss; only increasing once renal disease is relatively severe. The loss or injury to nephrons that occurs in CKD is usually permanent. As a result, treatments for CKD do not, in general, increase GFR. They either act to slow disease progression by improving the longevity of the remaining nephrons, or address patient morbidity improving quality of life while the patient lives with the disease. Earlier recognition of CKD would enable more timely intervention while nephron number is relatively preserved, with the expectation that this will lead to improved patient outcomes.
-
There are 3 main reasons that all filtration biomarkers (e.g. urea, creatinine, SDMA, cystatin C) are insensitive markers of mild nephron loss: 1). Curvilinear (hyperbolic) relationship with GFR; 2). Hyperfiltration and hypertrophy of remnant nephrons; 3). Wide population reference intervals due to breed-related and inter-individual differences in GFR. In addition, there are factors that are specific to individual biomarkers that either increase or decrease their value, reducing the strength of their correlation with GFR and complicating their use for diagnosis of renal disease. Examples are the influence of muscle mass on creatinine concentration and of certain types of cancer, notably lymphoma, on SDMA.
The hyperbolic relationship between filtration biomarkers and GFR explains why once renal disease is advanced further small absolute changes in GFR will cause large absolute increases in biomarker concentrations. Conversely, when GFR is normal large changes must occur before this is reflected by an increase in biomarker concentration. This is illustrated in the graph above where A & B represent the same change in GFR from either a high (A) or low (B) initial value, resulting in a corresponding negligible (a) or substantial (b) change in concentration of a filtration biomarker. The relationship between filtration biomarkers and GFR can be linearised by considering the reciprocal of the measurement which has been used in some publications particularly when monitoring changes that occur over time.1
The significance of hyperfiltration and hypertrophy of remnant nephrons following reduction in renal mass is well exemplified by kidney donation in humans, where individual kidney GFR is often measured before and after surgery. The GFR increases by around 40% in the non-donated kidney, due to a combination of hyperfiltration and hypertrophy.2 An increase in single-nephron GFR has also been demonstrated experimentally in sub-total nephrectomy models of renal disease in dogs and cats. 3,4 This process, although homeostatic in maintaining renal function following injury may be mal-adaptive in the longer term, with glomerular hypertension proposed to contribute to the progression of renal disease. Regardless, this compensatory response means that the reduction in GFR in early renal disease is not proportionate to the number of nephrons that have been lost. What this means in practical terms is that even when GFR is directly estimated by measuring renal clearance it is difficult to detect nephron loss if there is no baseline measurement to compare with.
Marked differences in ‘baseline’ GFR between patients, resulting in wide reference intervals, are also a barrier to the early diagnosis of CKD. In humans, it has been shown that there may be as much as 8-fold difference in nephron endowment between individuals at birth.5 In healthy beagle dogs the variability in GFR is much greater dog-to-dog (almost 2-fold), than day-to-day (about 8%).6 The difference in baseline GFR (and consequently also filtration biomarkers such as creatinine and SDMA) in healthy dogs is particularly marked because of differences between breeds, partly but not entirely due to differences in size. In general, larger dogs have lower GFR, at least when this is indexed to body weight or extracellular volume.7 As a result larger dogs tend to have higher concentrations of filtration biomarkers, although even when breeds of similar weight are compared differences between them are evident.8 Healthy Birman cats frequently have concentrations of filtration biomarkers (creatinine, SDMA) that exceed typical laboratory reference intervals suggesting that cats of this breed have lower baseline GFR.9 This heterogeneity in baseline renal function between breeds leads to very wide reference intervals for filtration biomarkers, and consequently a lack of sensitivity for detection of early or mild CKD. Ideally in the future collaboration between laboratories will lead to the establishment of breed-specific reference ranges, at least for the most common breeds.
When these barriers to diagnosis are considered collectively it is clear that all filtration biomarkers will have the same inherent limitations for detecting mild CKD. All of these markers (creatinine, SDMA, cystatin B etc) can be made more sensitive by reducing the cut-off above which the patient is considered to be azotaemic, but this will almost inevitably result in a reduction in specificity. A frequent issue encountered in clinical practice is that the results of different tests are discordant, with one biomarker suggesting that CKD exists and another being normal. As discussed below it is often necessary to use clinical judgement to determine what fits the clinical picture best. For example, a patient may be cachexic and creatinine considered to over-estimate the patient’s GFR, resulting in a diagnosis of CKD when the creatinine is still within the laboratory reference interval. Or a patient may have a creatinine that is robustly normal and elevated SDMA and in the absence of other indicators of renal disease the patient is concluded not to have CKD.
-
Measurement of renal biomarkers can be made more sensitive for detection of early or mild CKD if a baseline measurement is made when the patient is a healthy young adult. If the value subsequently increases by more than the critical difference (a composite value that encompasses differences in laboratory measurement and day-to-day variation within the individual patient) this indicates that GFR has declined. It is then important to ensure that this change is not due to pre-renal (hypoperfusion) or post-renal (obstruction, urine leakage) causes before concluding that the patient has kidney disease. Clinical distinction also needs to be made between acute and chronic disease.
Longitudinal monitoring of renal biomarkers would be easier if veterinary diagnostic laboratories would embrace harmonisation as has happened in human medicine. Laboratory harmonisation is the process of making medical test results equal and comparable across laboratories. Even though creatinine is commonly measured using two different methods (Jaffe, enzymatic) it has been possible through use of isotope dilution reference standards to standardise measurements between laboratories and analysers.10 This has great clinical utility because repeated measurement of renal biomarkers is at least as sensitive as renal clearance methods in detecting changes in GFR in humans.11
-
CKD can be defined as an abnormality of kidney structure or function, present for a minimum of 3-months, with implications for health. While many patients with CKD will have reduction in GFR this is not invariably the case. The kidney has many different functions and removal of solute (i.e. through GFR) is only one of these. For example, the presence of sustained renal proteinuria is also sufficient to indicate a diagnosis of CKD (see Proteinuria article). Patients with primary glomerular disease can have severe proteinuria, even resulting in nephrotic syndrome, and remain non-azotaemic.
Occasionally patients with specific breed predispositions could be diagnosed with CKD with specific tests performed before the onset of any overt functional abnormality. Examples include detection of genetic diseases (e.g. polycystic kidney disease, hereditary nephritic in cocker spaniels) or testing for Fanconi syndrome in Basenjis. However, these tests are generally not useful in the detection of CKD in the population at large.
There are ongoing efforts in both human and veterinary medicine to establish new biomarkers for detection of CKD. Many studies have explored using -omics technologies, with some success, although promising results are not always repeatable or transferrable to wider populations.12 None of these have yet resulted in the development of tests that are in widespread clinical use, although this may happen in the future.
-
Diagnostic imaging is often used to support a diagnosis of CKD and may be particularly useful in the differentiation of acute and chronic disease. However, it can be difficult to determine whether a diagnosis of CKD is appropriate when changes in renal appearance are discovered incidentally. In some instances, the changes are marked and lead to a specific diagnosis (for instance polycystic kidney disease). More often changes are in the renal architecture are relatively non-specific (loss of cortico-medullary definition, increased cortical echogenicity) and their significance is uncertain. It is important to note that any changes detected must be considered to have ‘implications for health’ to be sufficient to result in diagnosis of CKD. For example, an isolated renal cyst is a structural abnormality that does not typically result in clinical signs or lead to progressive renal dysfunction.
-
Diagnosis CKD when it is mild, or early, typically does not rely on any single test in isolation. Instead, multiple strands of evidence are woven together to build a picture of CKD. For example, most clinicians would agree a 15-year-old cat with poor body and muscle condition and high-normal creatinine concentration, sub-maximally concentrated urine and an irregular renal contour on ultrasound has CKD. What is less certain is whether this CKD will ever be of clinical significance to the cat. Will it be progressive and ultimately lead to the patient’s death? Will it cause morbidity? This is less clear.
-
1. Cowgill LD, Segev G, Vaden S, et al. Differentiation of stable kidney function versus progressive dysfunction in dogs. J Vet Intern Med 2023;37:2241–2250.
2. Lenihan CR, Busque S, Derby G, et al. Longitudinal study of living kidney donor glomerular dynamics after nephrectomy. J Clin Invest 2015;125:1311–1318.
3. Brown SA, Brown CA. Single-nephron adaptations to partial renal ablation in cats. Am J Physiol 1995;269:R1002–1008.
4. Brown SA, Finco DR, Crowell WA, et al. Single-nephron adaptations to partial renal ablation in the dog. Am J Physiol Renal Physiol 1990;258:F495–503.
5. Tsuboi N, Kanzaki G, Koike K, et al. Clinicopathological assessment of the nephron number. Clin Kidney J 2014;7:107–114.
6. Kampa N, Bostrom I, Lord P, et al. Day-to-day variability in glomerular filtration rate in normal dogs by scintigraphic technique. J Vet Med A Physiol Pathol Clin Med 2003;50:37–41.
7. Bexfield NH, Heiene R, Gerritsen RJ, et al. Glomerular filtration rate estimated by 3-sample plasma clearance of iohexol in 118 healthy dogs. J Vet Intern Med 2008;22:66–73.
8. Iwasa N, Takashima S, Iwasa T, et al. Effect of age, sex, and breed on serum cystatin C and creatinine concentrations in dogs. Vet Res Commun 2022;46:183–188.
9. Paltrinieri S, Ibba F, Rossi G. Haematological and biochemical reference intervals of four feline breeds. J Feline Med Surg 2014;16:125–136.
10. Killeen AA, Ashwood ER, Ventura CB, et al. Recent Trends in Performance and Current State of Creatinine Assays. Archives of Pathology & Laboratory Medicine 2013;137:496–502.
11. Rowe C, Sitch AJ, Barratt J, et al. Biological variation of measured and estimated glomerular filtration rate in patients with chronic kidney disease. Kidney International 2019;96:429–435.
12. Chu CP, Nabity MB. Technical considerations and review of urinary microRNAs as biomarkers for chronic kidney disease in dogs and cats. Veterinary Clinical Pathology 2025;54:S52–S70.